Simulation models create heaps of performance data for every component in a modeled system (transactional, state, and usage data). However, understanding what that data represents with regards to other data can be very challenging – essentially deciphering component relationships. This is where visual analytics plays a very big role and is a vital component of relationship analysis.
Visual analytics focuses on analytical reasoning facilitated by interactive dashboards to identify improvement opportunities. We customize our dashboards to the clients needs to ensure they are receiving the full benefit of the simulation models.
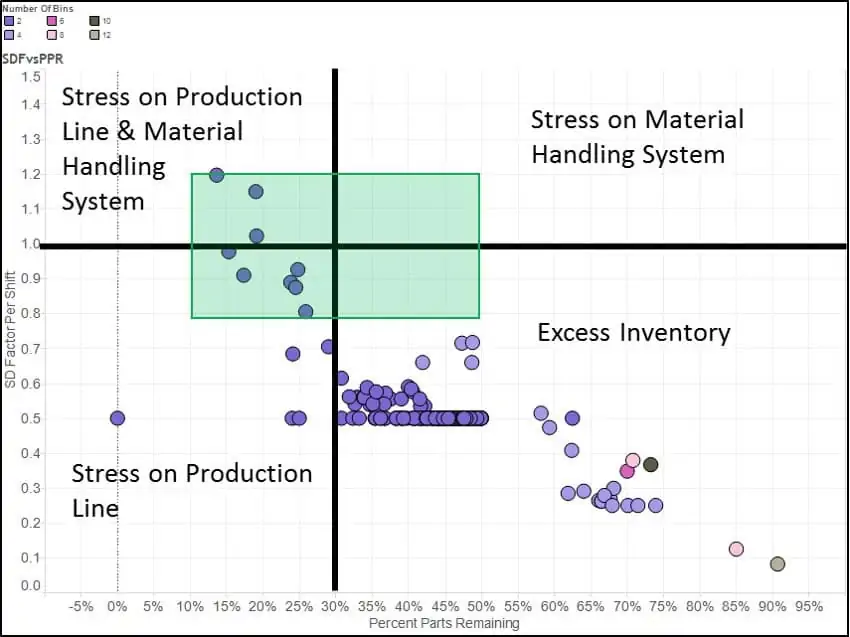
The picture attached is one example of a chart that we created for a client in the manufacturing industry. Keeping it easy to understand for the client is the key to getting the answers they need. In the graphic, each dot represents a class of inventory depending upon how many containers are utilized in the production line. On the X axis there is the Percent Parts Remaining (PPR) and the Y axis is the Supply/Demand Factor (SDF).
Without knowing much about the calculations of PPR and SDF, with a little bit of discussion a person will quickly notice that the green box (or “good zone”) represents the optimal position for that inventory strategy. As part types stray outside of that box they enter different “stressors” on the production and material handling system. Also, the colors representing the number of bins (or container count) will illustrate a trend of higher bin counts being further away from the good zone.
The graph is elegant because it gets the point across visually without much explanation, but there is no one tool that can deliver the insights into system performance. Visual analytics combined with knowledge of the model, knowledge of the real system, and systematic experimentation together create insights.
Please contact me if you would like to learn more on how MOSIMTEC can assist your business.
